Project leader: Shazada Muhammad Umair Khan, PhD, Associate Professor, Department of Intelligent Systems and Cybersecurity
Project Goal: This project aims to create an interface from Probabilistic Timed Automata (PTA) and perform formal verification through branching bisimulation analysis. The main objective is to establish predictable and safe operator-automated system interaction under both probabilistic uncertainty and strict real-time constraints.
This work establishes objectives to improve software system reliability and usability and security with emphasis on user interface and system behavior. The first objective involves formal property verification through behavioral equivalence to protect systems from external observation while maintaining confidentiality. The second and third objectives focus on user interface design and interaction aspects by identifying essential design activities and assessing multiple interaction styles to enhance user experience. The last objective aims to develop strong design principles which enable supervisory control and prevent system errors and failures in user interfaces. These goals work together to create software systems that are secure and user-focused and resistant to faults.
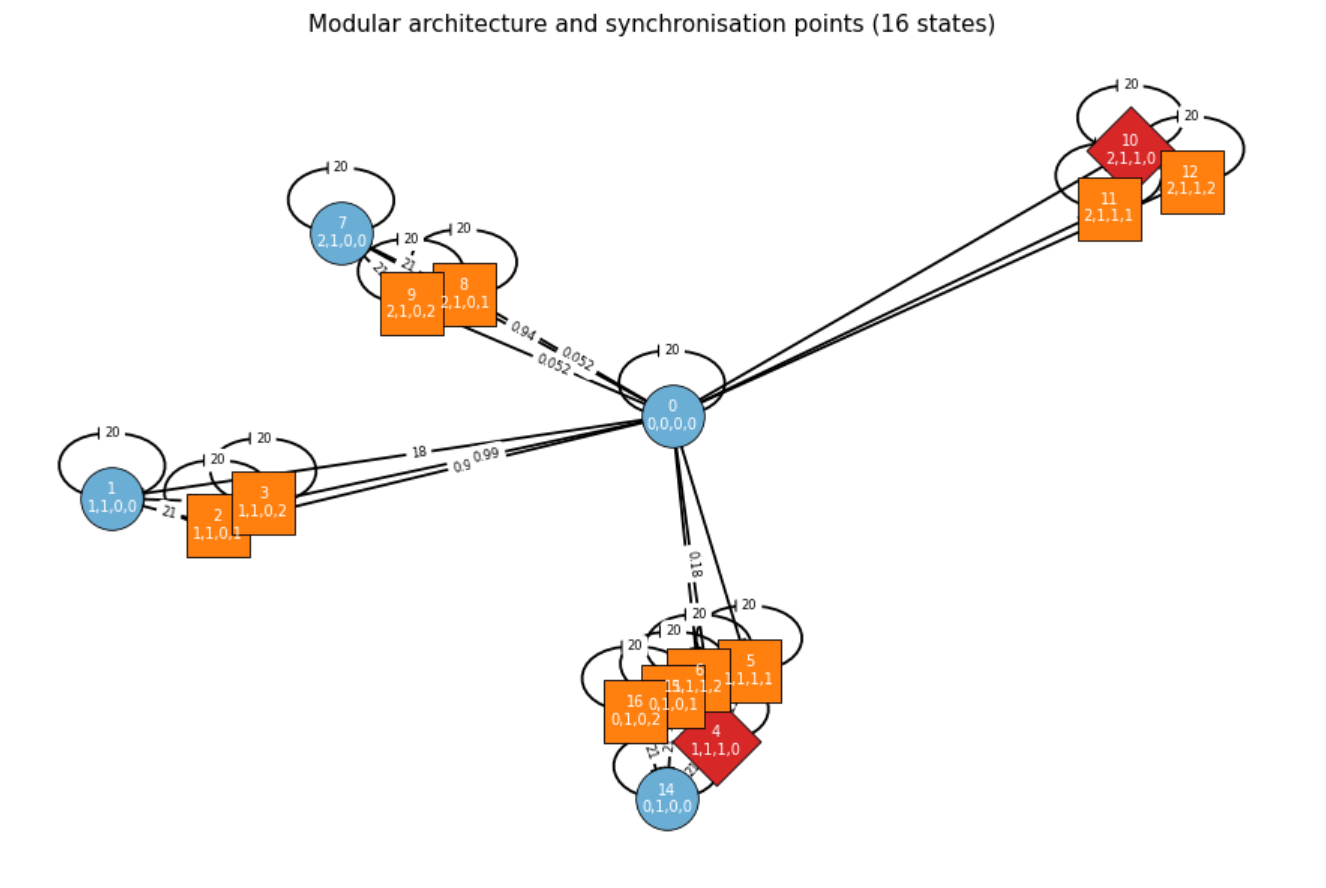
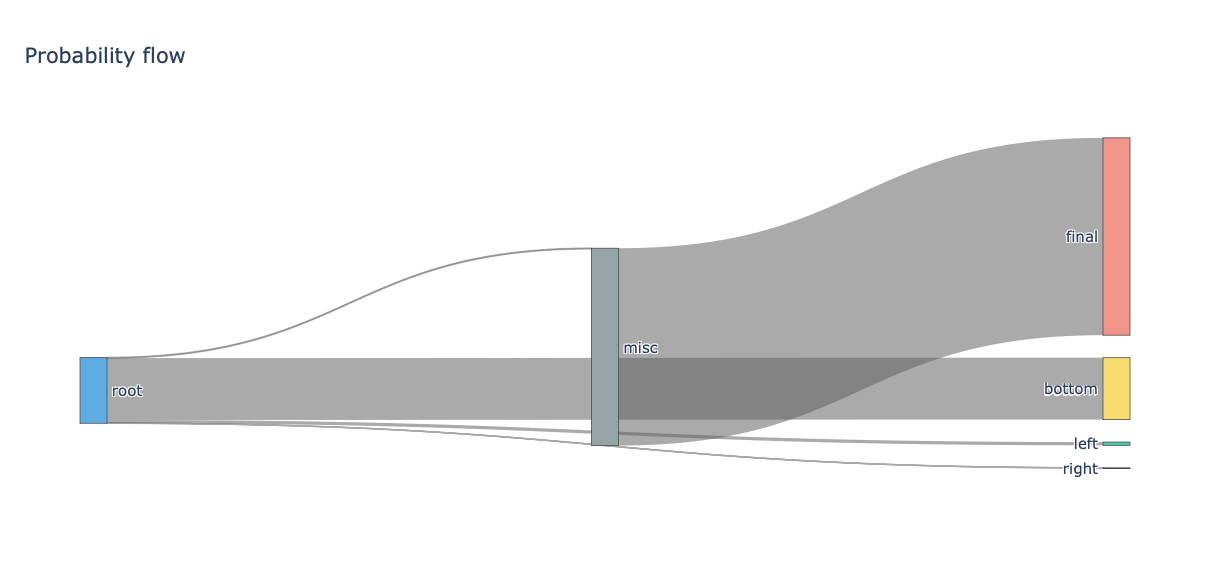
1. All controller–pilot, avionics, and supervisory interactions from the requirements capture procedure led to a 358-state Markov decision process (MDP) that precisely models the probabilistic timed automaton. The global timer t used twenty-tick cycles to represent real-time deadlines through a one-and-a-half-second tick duration (see Figure 1).
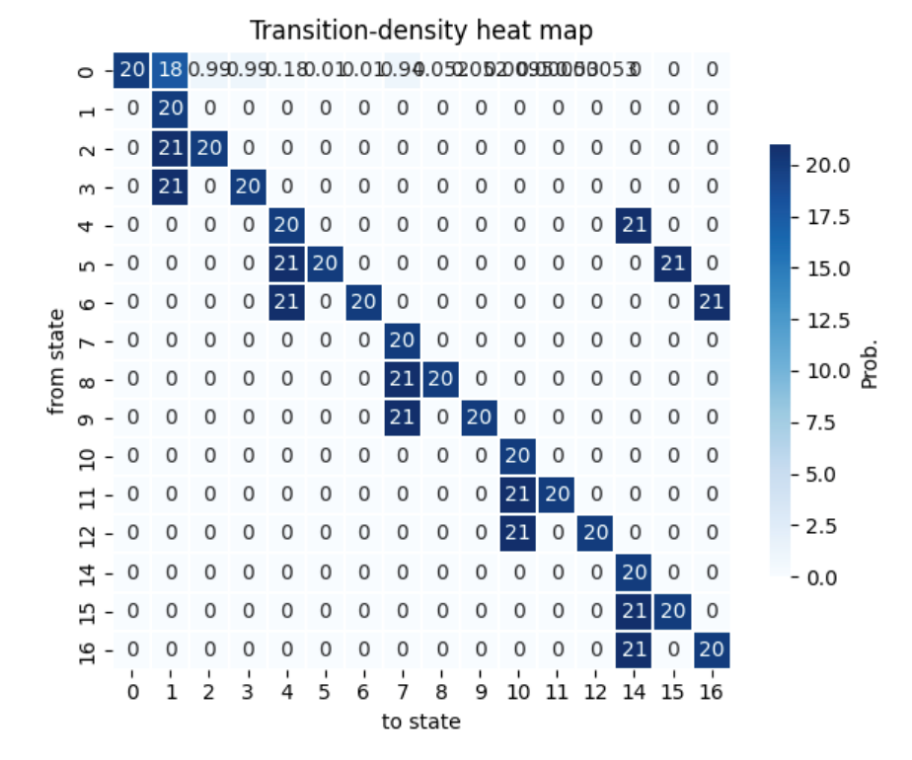
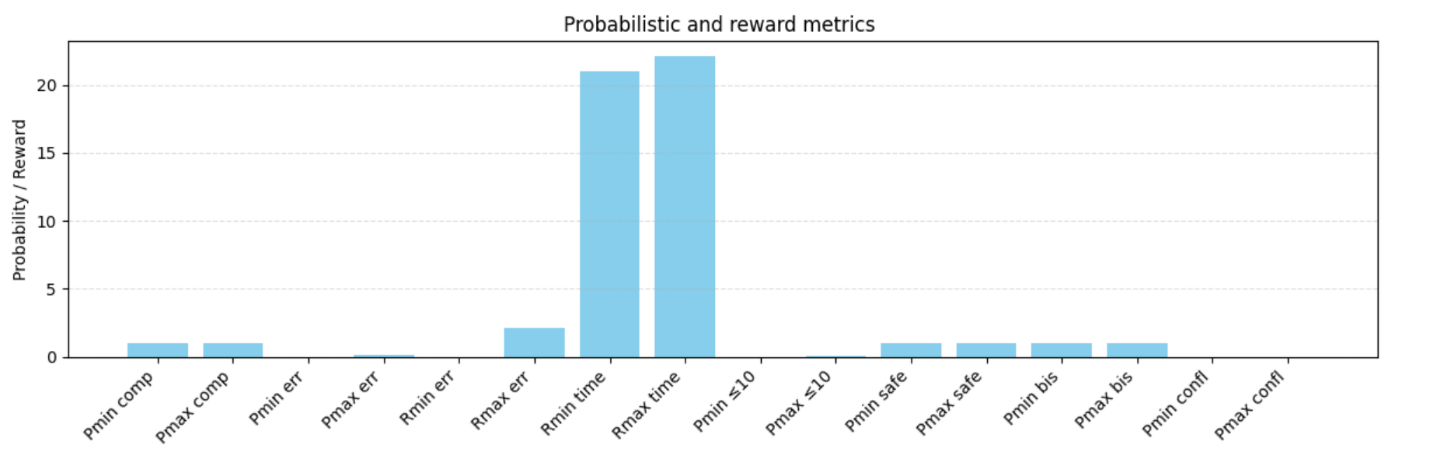
2. The composed MDP underwent breadth-first exploration which achieved convergence at 23 iterations to reveal 946 probabilistic transitions. The Bellman equations received value-iteration solutions for reachability and reward expectations which achieved a residual below to confirm numerical soundness for both pessimistic and optimistic scheduler resolutions.
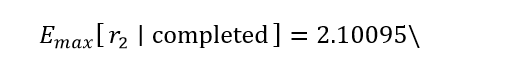
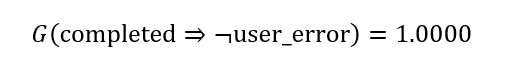
3. A total of sixteen PTCTL properties underwent evaluation. Any adversarial or cooperative scheduling policy leads to inevitable mission termination because unconditional reachability of the terminal label (“completed”) proved both
worst-case slip probability showed that error likelihood reached its maximum at ten percent of all executions
the best-case slip probability indicated that particular scheduler strategies could prevent crew-induced deviations completely.
4. The Reward Structure evaluated the expected number of slips until the mission ended.
The most beneficial scheduling produced
the most detrimental scheduling produced
thus revealing how scheduling decisions impact reliability.
5. The Reward Structure measured completion time by tracking the number of ticks.
The smallest expected value of r_1 given completion was
while the highest value was
indicating a restricted time frame.
6. The ten-tick service objective led to bounded-time reachability where
that only 4.95 % of traces satisfied the deadline while showing the delay from internal confirmation loops.
7. The safety invariant:
maintained its validity at probability one for all scheduling options which ensured no crew slips occurred after mission completion.
The bisimulation invariant
showed that the observable interface stayed semantically aligned with the concealed avionics model throughout the entire execution
8. The supervisory veto mechanism operated with complete coherence because
all possible adversarial scheduling choices.
9. The graph-theoretic decomposition process using Kosaraju’s algorithm revealed three strongly connected components that consisted of waiting, confirmation and dispatch. The confirmation SCC maintained a stationary probability mass distribution of approximately 70 % as indicated by its dominant diagonal band in the transition-density heat map (Figure 2) and its broad ribbon in the Sankey diagram of probability flow (Figure 3).
10. All probabilistic and reward metrics receive graphical comparison in the bar chart of Figure 4 to show the tight probability bounds for completion versus the extensive error count and latency variations.
The complete quantitative envelope is summarized in Table 1 which is presented next to Figure 2.
Table 1. Baseline PTZ model receives its quantitative results as described below
Metric |
Interpretation |
Minimum |
Maximum |
P(F ”completed” ) |
Inevitable mission completion |
1.000 |
1.000 |
P(F ”user\_error” ) |
Risk of at least one slip |
0.0000 |
0.1000 |
E[r_2∣F ”completed” ] |
Expected slips before completion |
0.0000 |
2.10095 |
E[r_1∣F ”completed” ] |
Expected ticks to completion |
21.0000 |
22.1095 |
P(F^(≤10) ”completed” ) |
Mission finishes within ten ticks |
0.0000 |
0.0495 |
P(G(“completed” ⇒¬ ”use” “r” _”e” “rror” )) |
Post-completion safety |
1.0000 |
1.0000 |
P(G ”bisim\_ok” ) |
Plant–interface equivalence |
1.0000 |
1.0000 |
P(F ”conflict” ) |
Supervisor–plant disagreement |
0.0000 |
0.000 |
Figure 1. The modular system structure together with synchronization points (16 states) forms the basis of the system. The system contains nine PRISM modules that communicate through four broadcast actions: input, feedback, u_done and force_done as well as the global timer t. The Fruchterman–Reingold positioning technique arranges state-transition probabilities on each edge of the visual layout.
Figure 2. Transition-density heat map. The matrix organizes the three operational SCCs—waiting, confirmation, dispatch—into sequential blocks which run along the diagonal. Pixel intensity indicates transition probability; the confirmation SCC appears as the brightest block, containing ~70 % of stationary probability mass.
Figure 3. Sankey diagram of probability flow. The node sizes in this diagram show the steady-state probabilities of the three SCCs and termination state. The confirmation SCC produces the largest amount of flow towards dispatch and final states as indicated by ribbon thicknesses in the diagram.
The bar chart in Figure 4 shows both probabilistic and reward metrics. All eight metrics are normalized to their maximum values to facilitate direct comparison: completion probabilities remain at unity, error and latency expectations manifest a broader envelope, and bounded-time reachability highlights deadline performance.
Shazada Muhammad Umair Khan
PhD, Associate Professor, Department of Intelligent Systems and Cybersecurity
Khassen Akbota
Project Executor, 3rd year student of Astana IT University
Myrzabek Kamila
Project Executor, 3rd year student of Astana IT University