A user-centric interface design was developed for the automated KPI management system, which takes into account all necessary criteria for an effective and enjoyable user experience (UX). The design optimizes the complex process of performance tracking by creating an intuitive and efficient workflow for all stakeholders.
This UI/UX framework was developed based on key criteria, including:
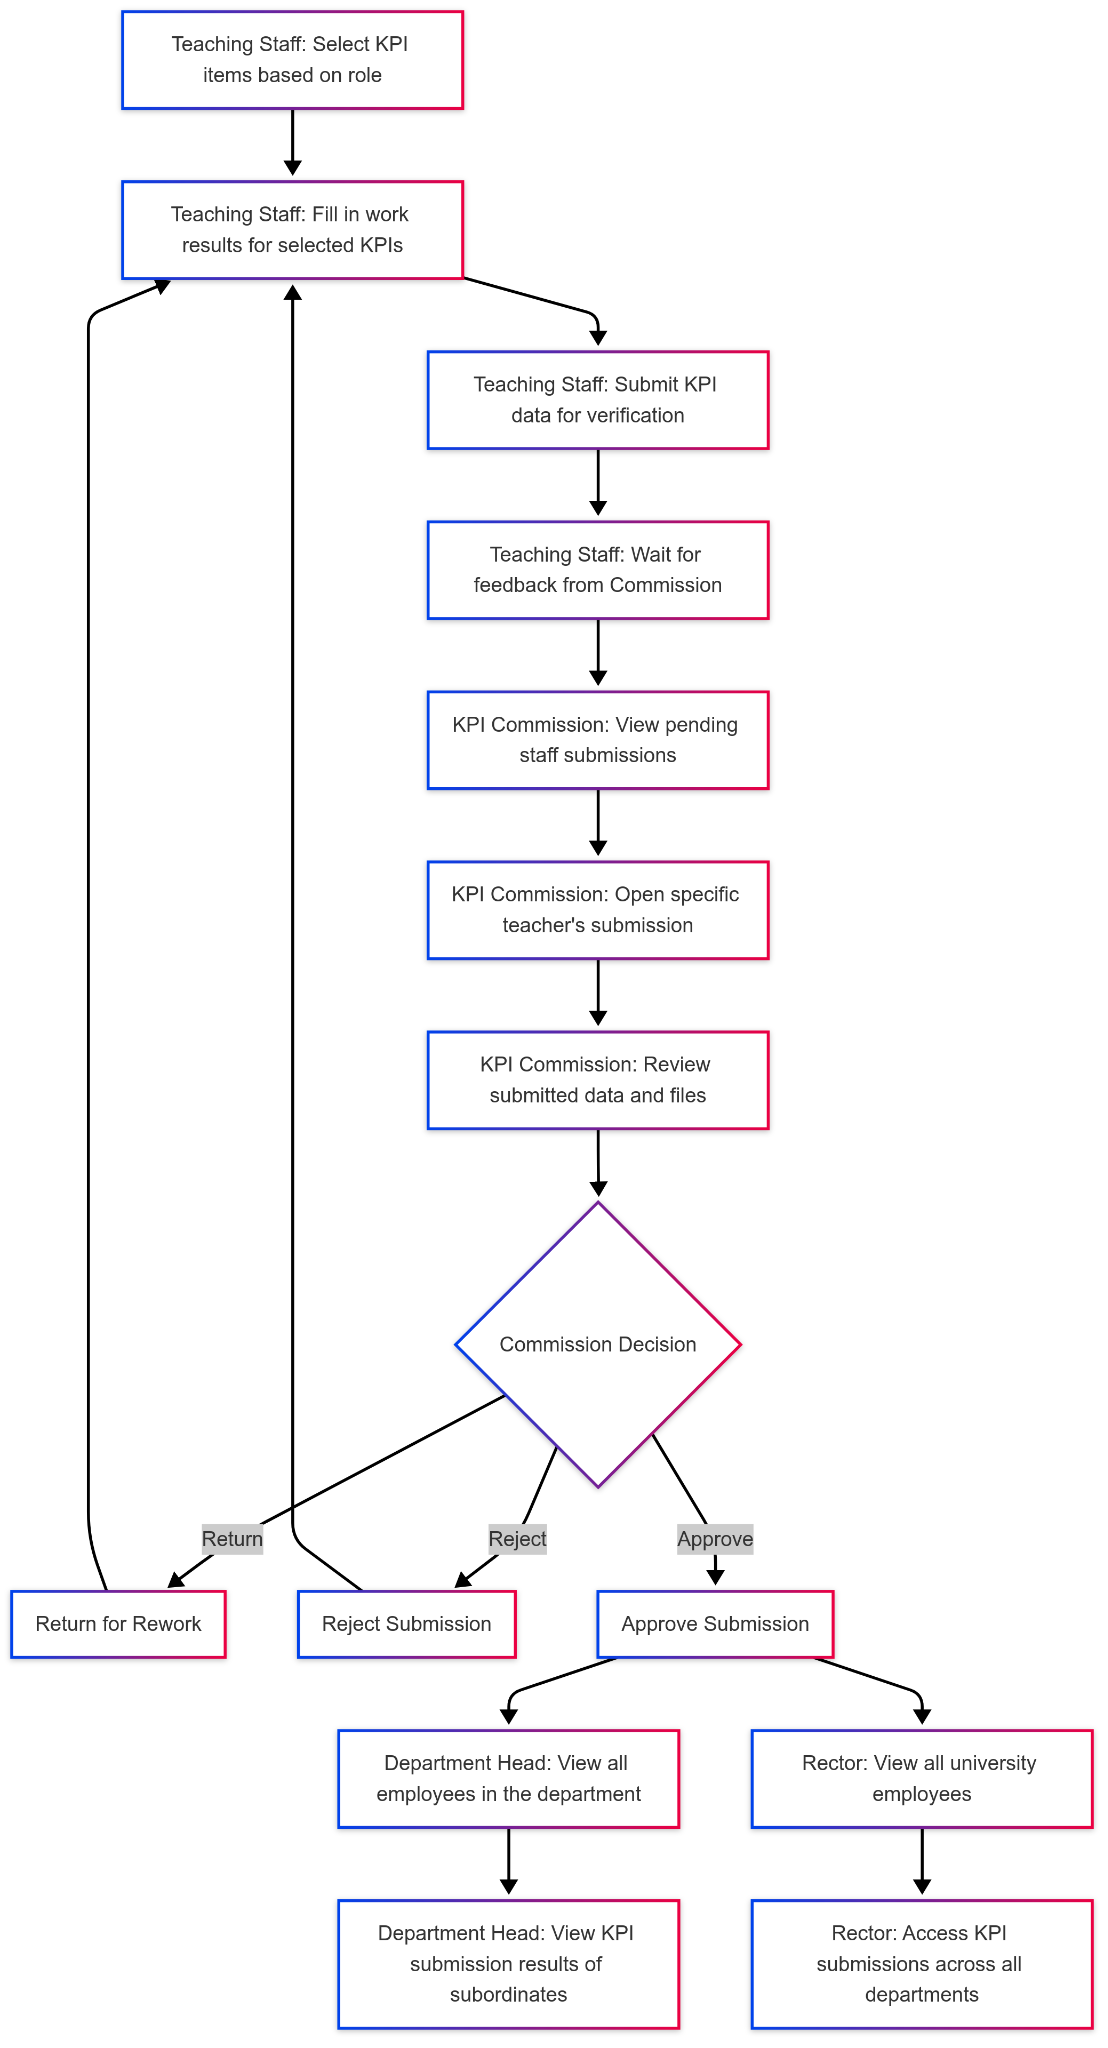
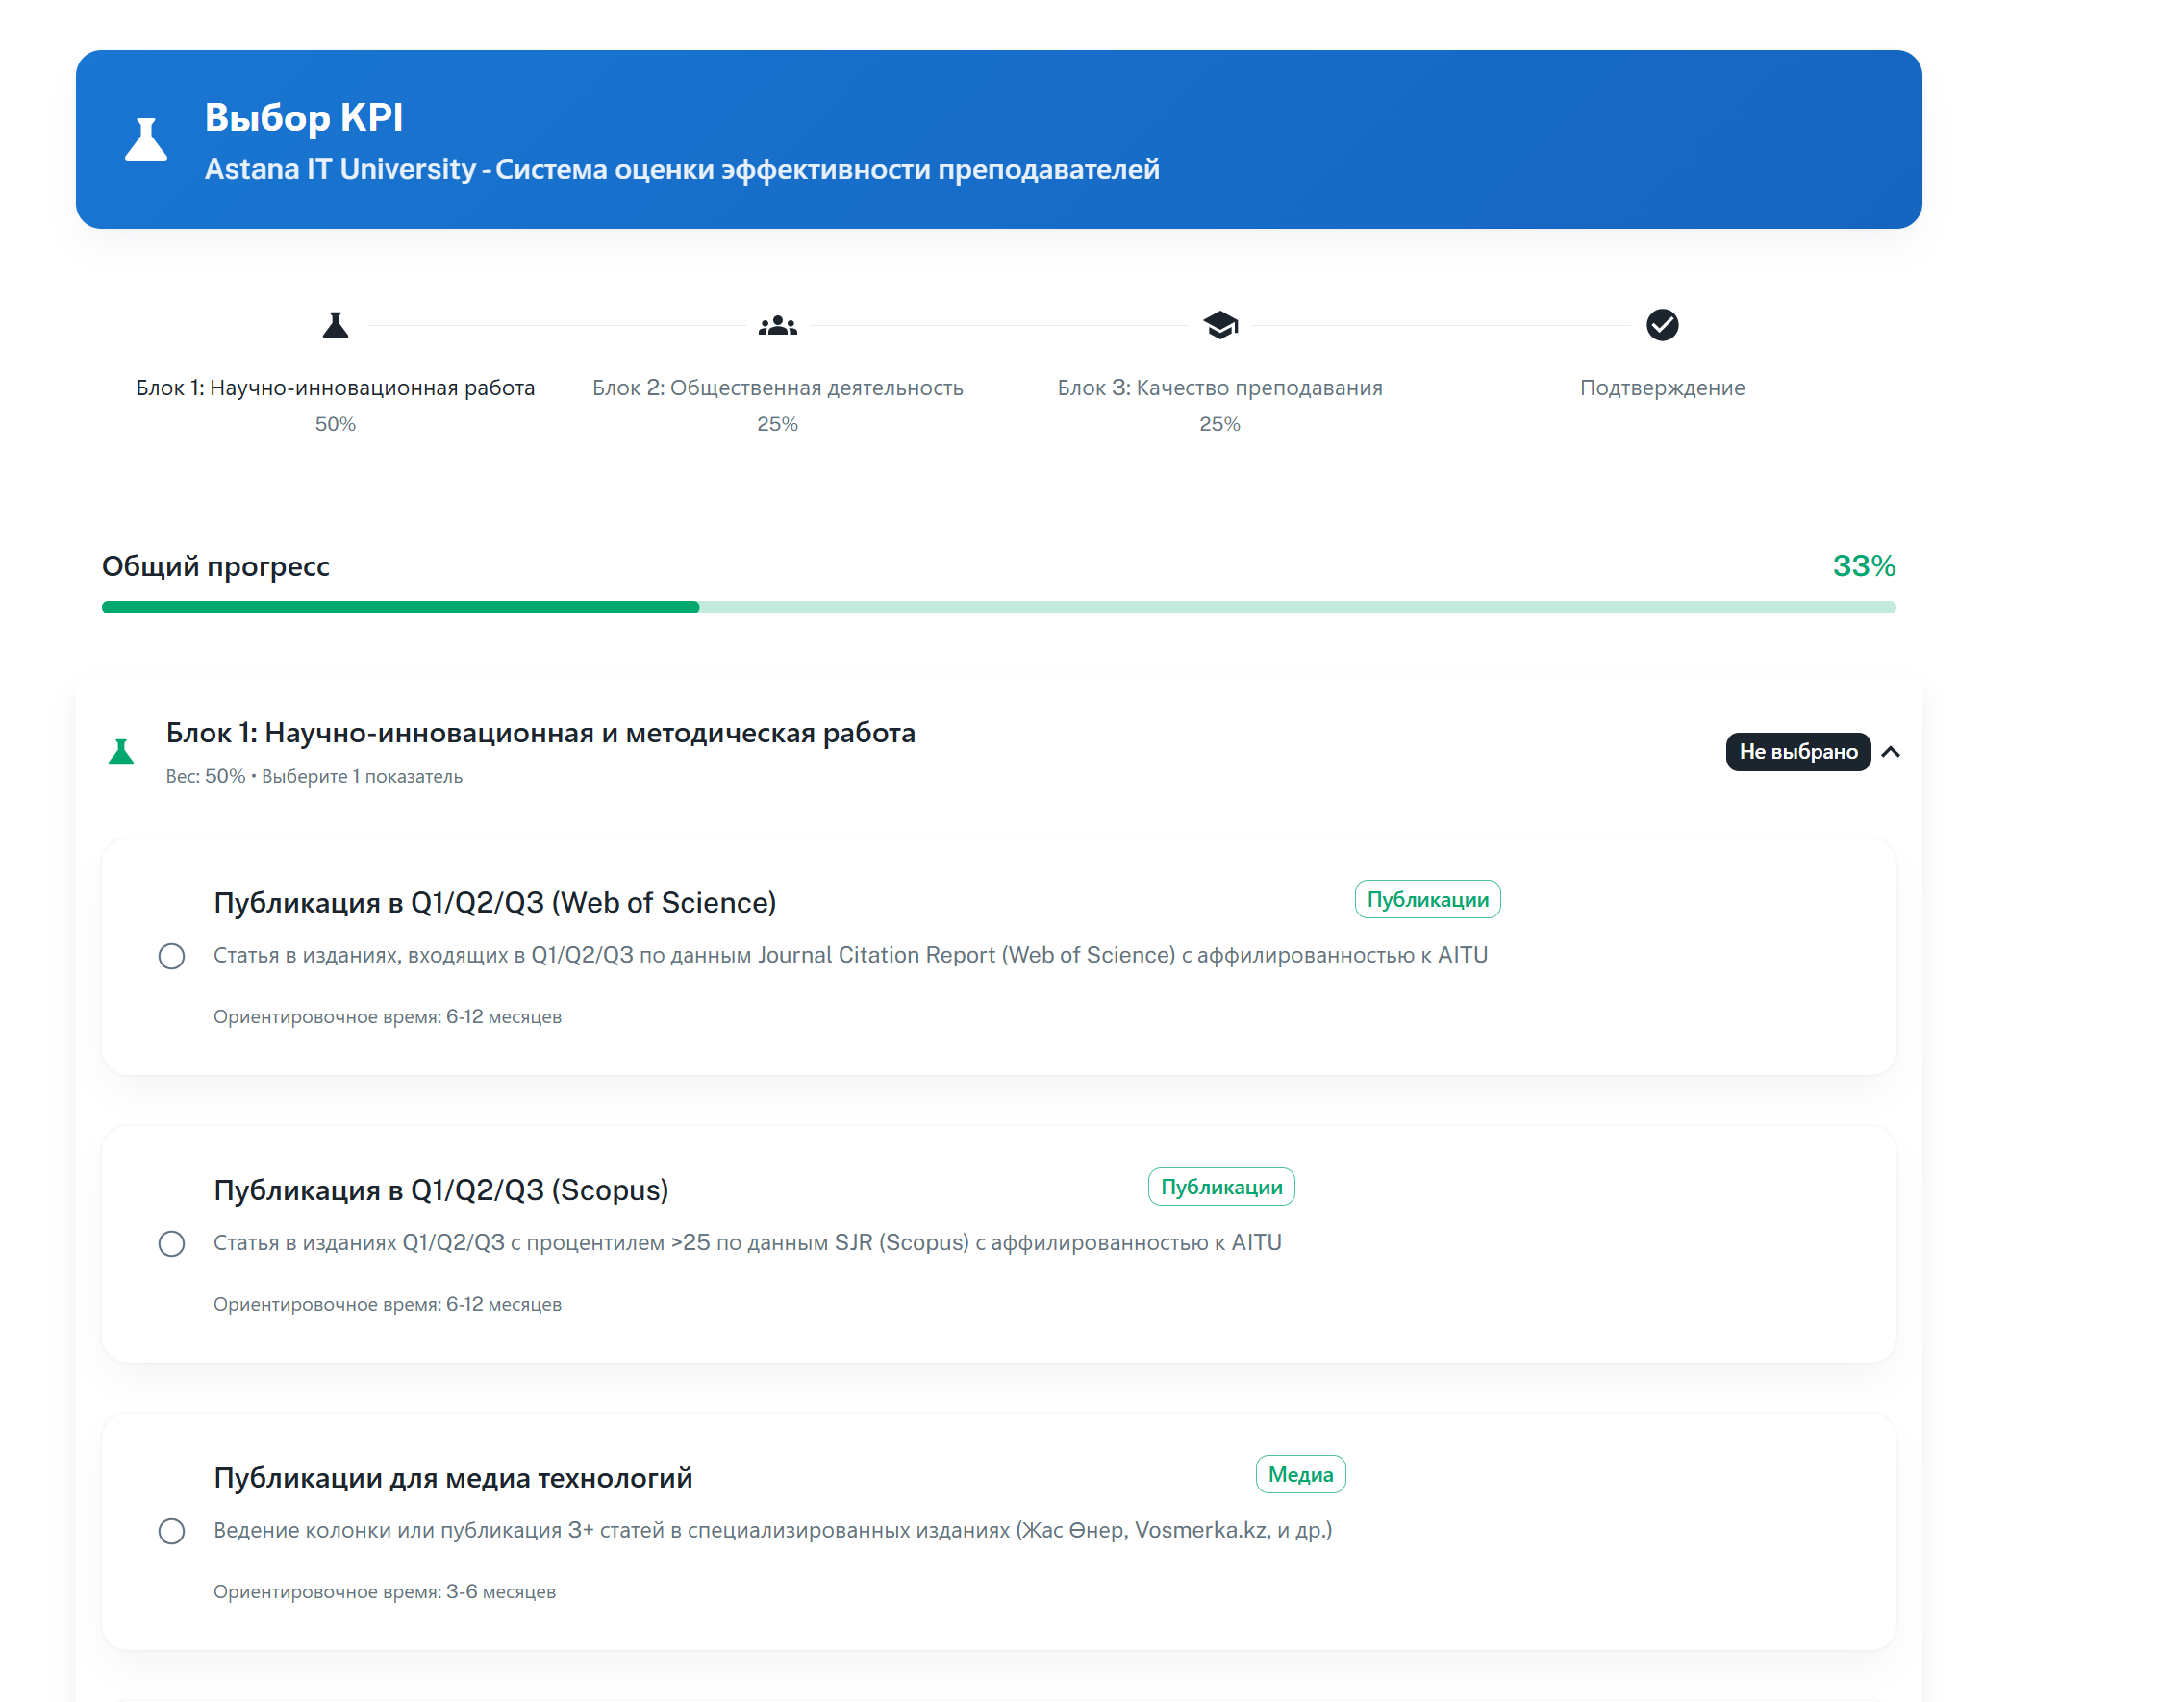
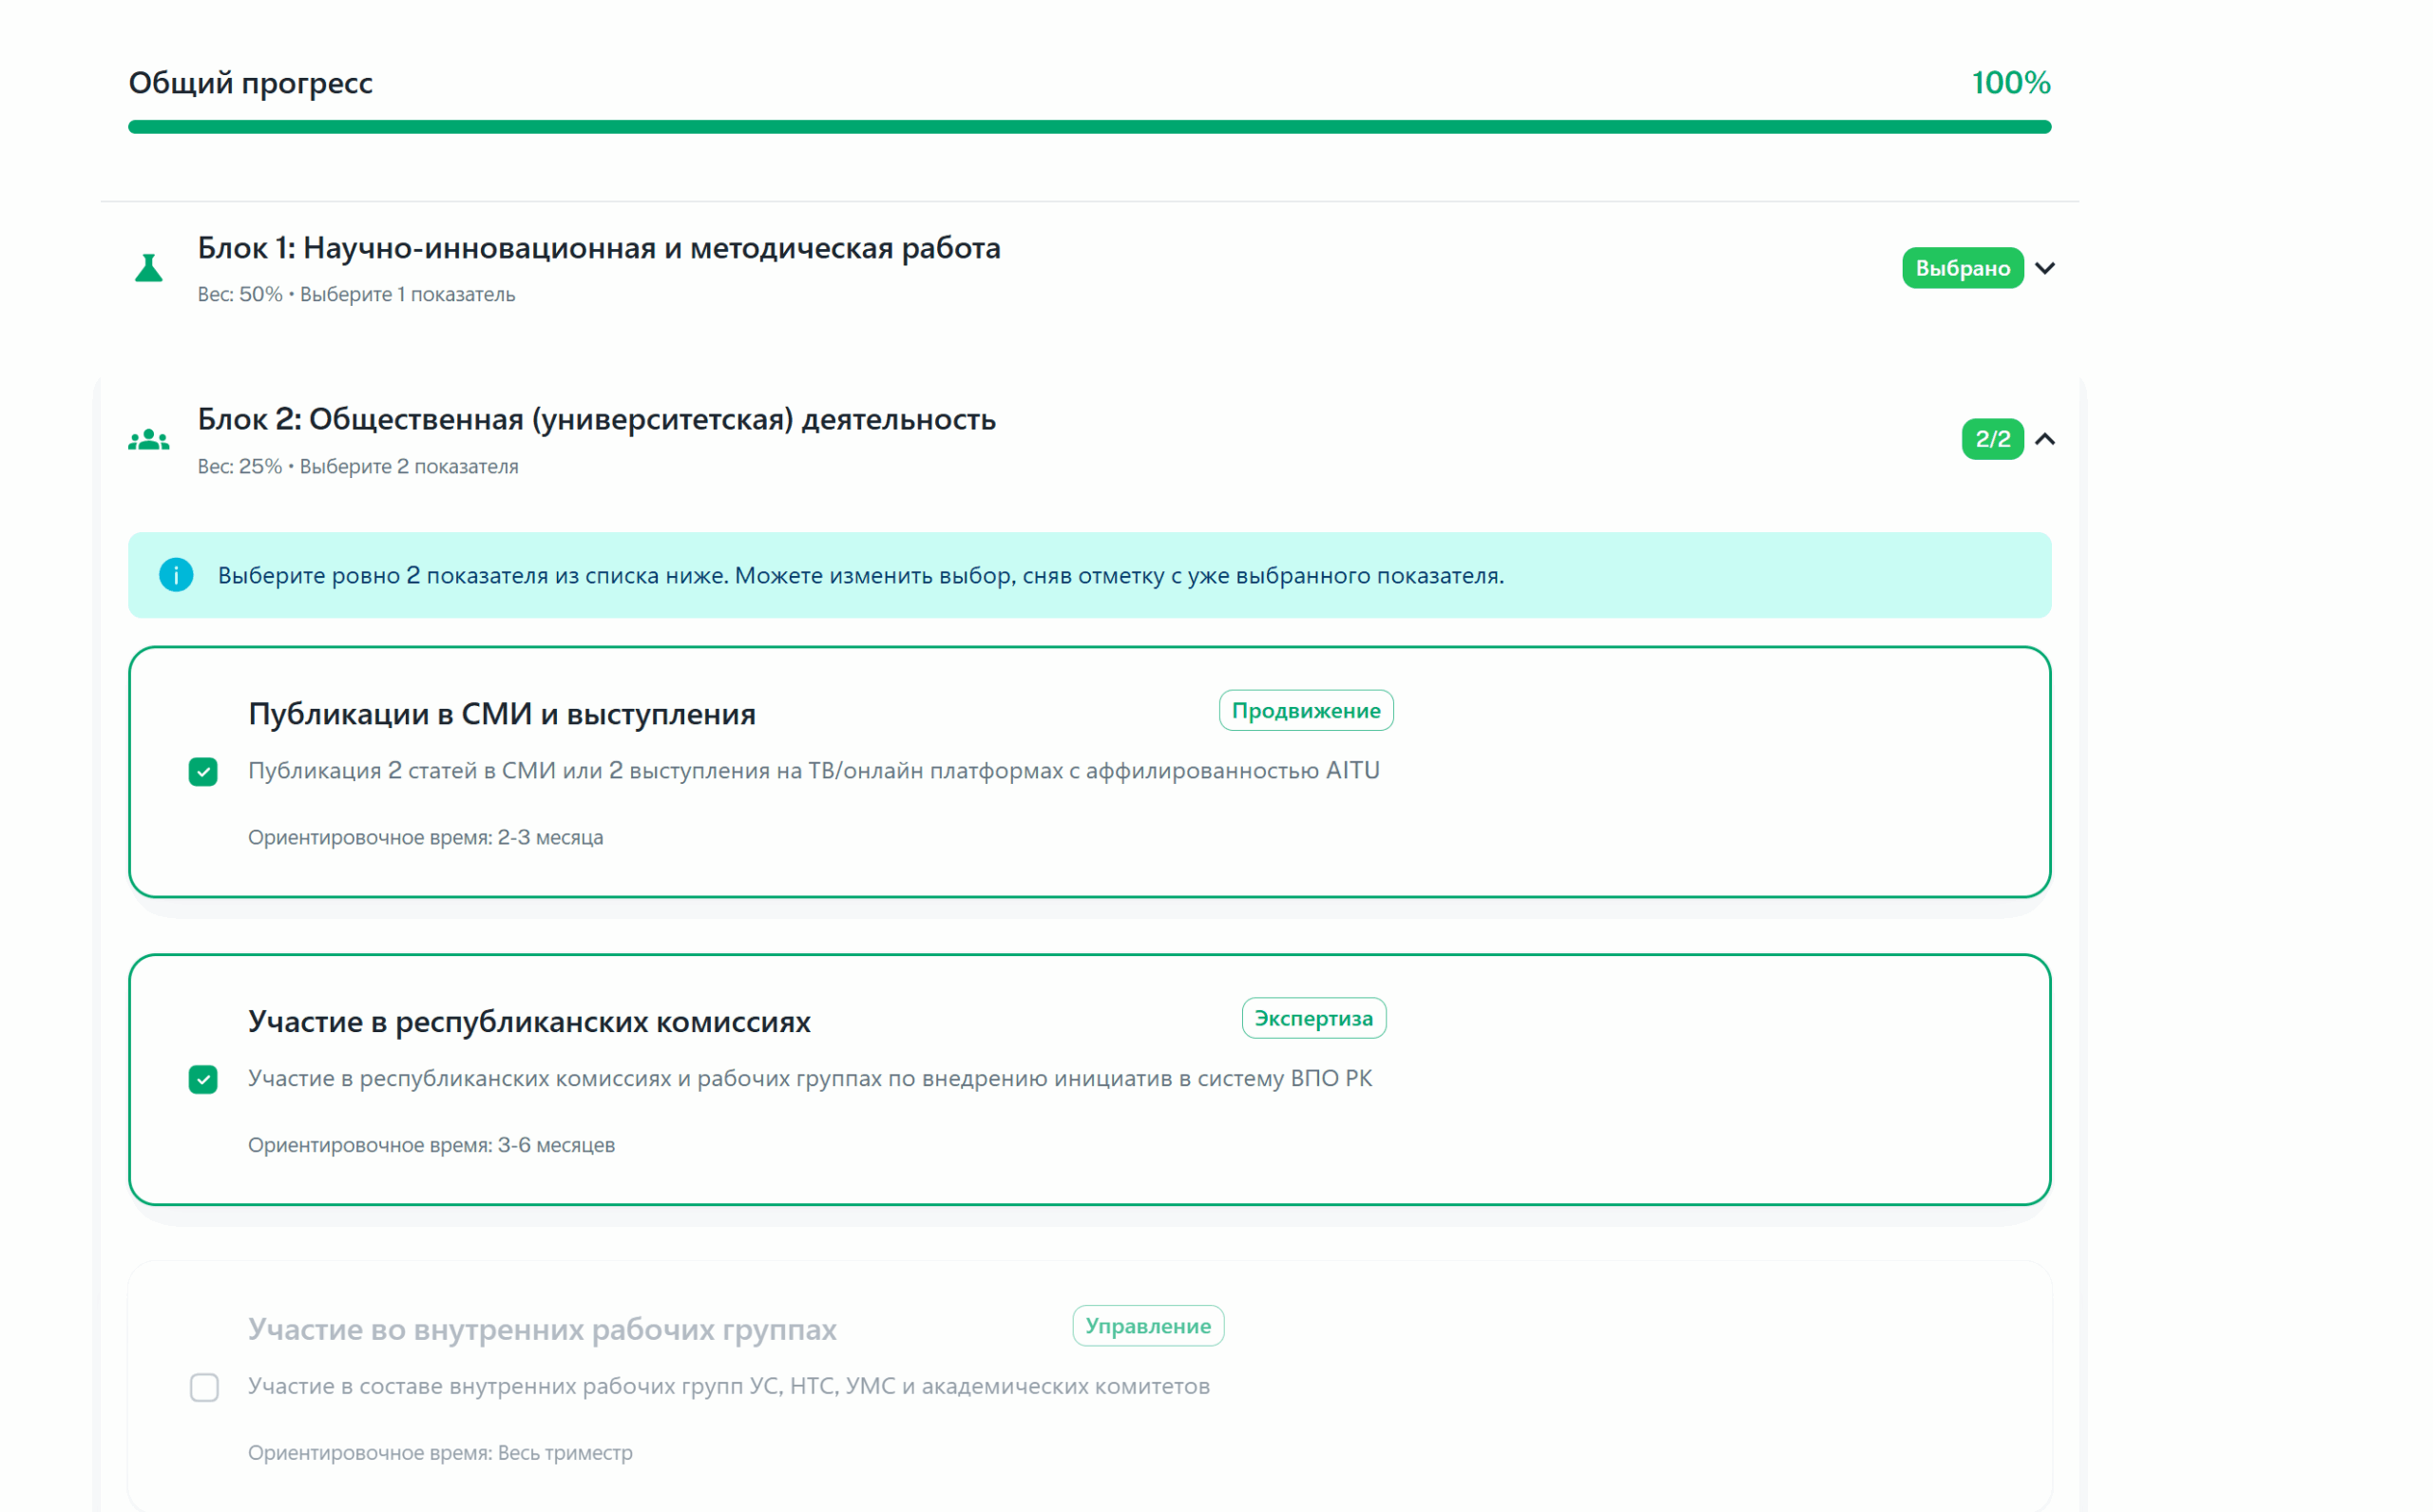
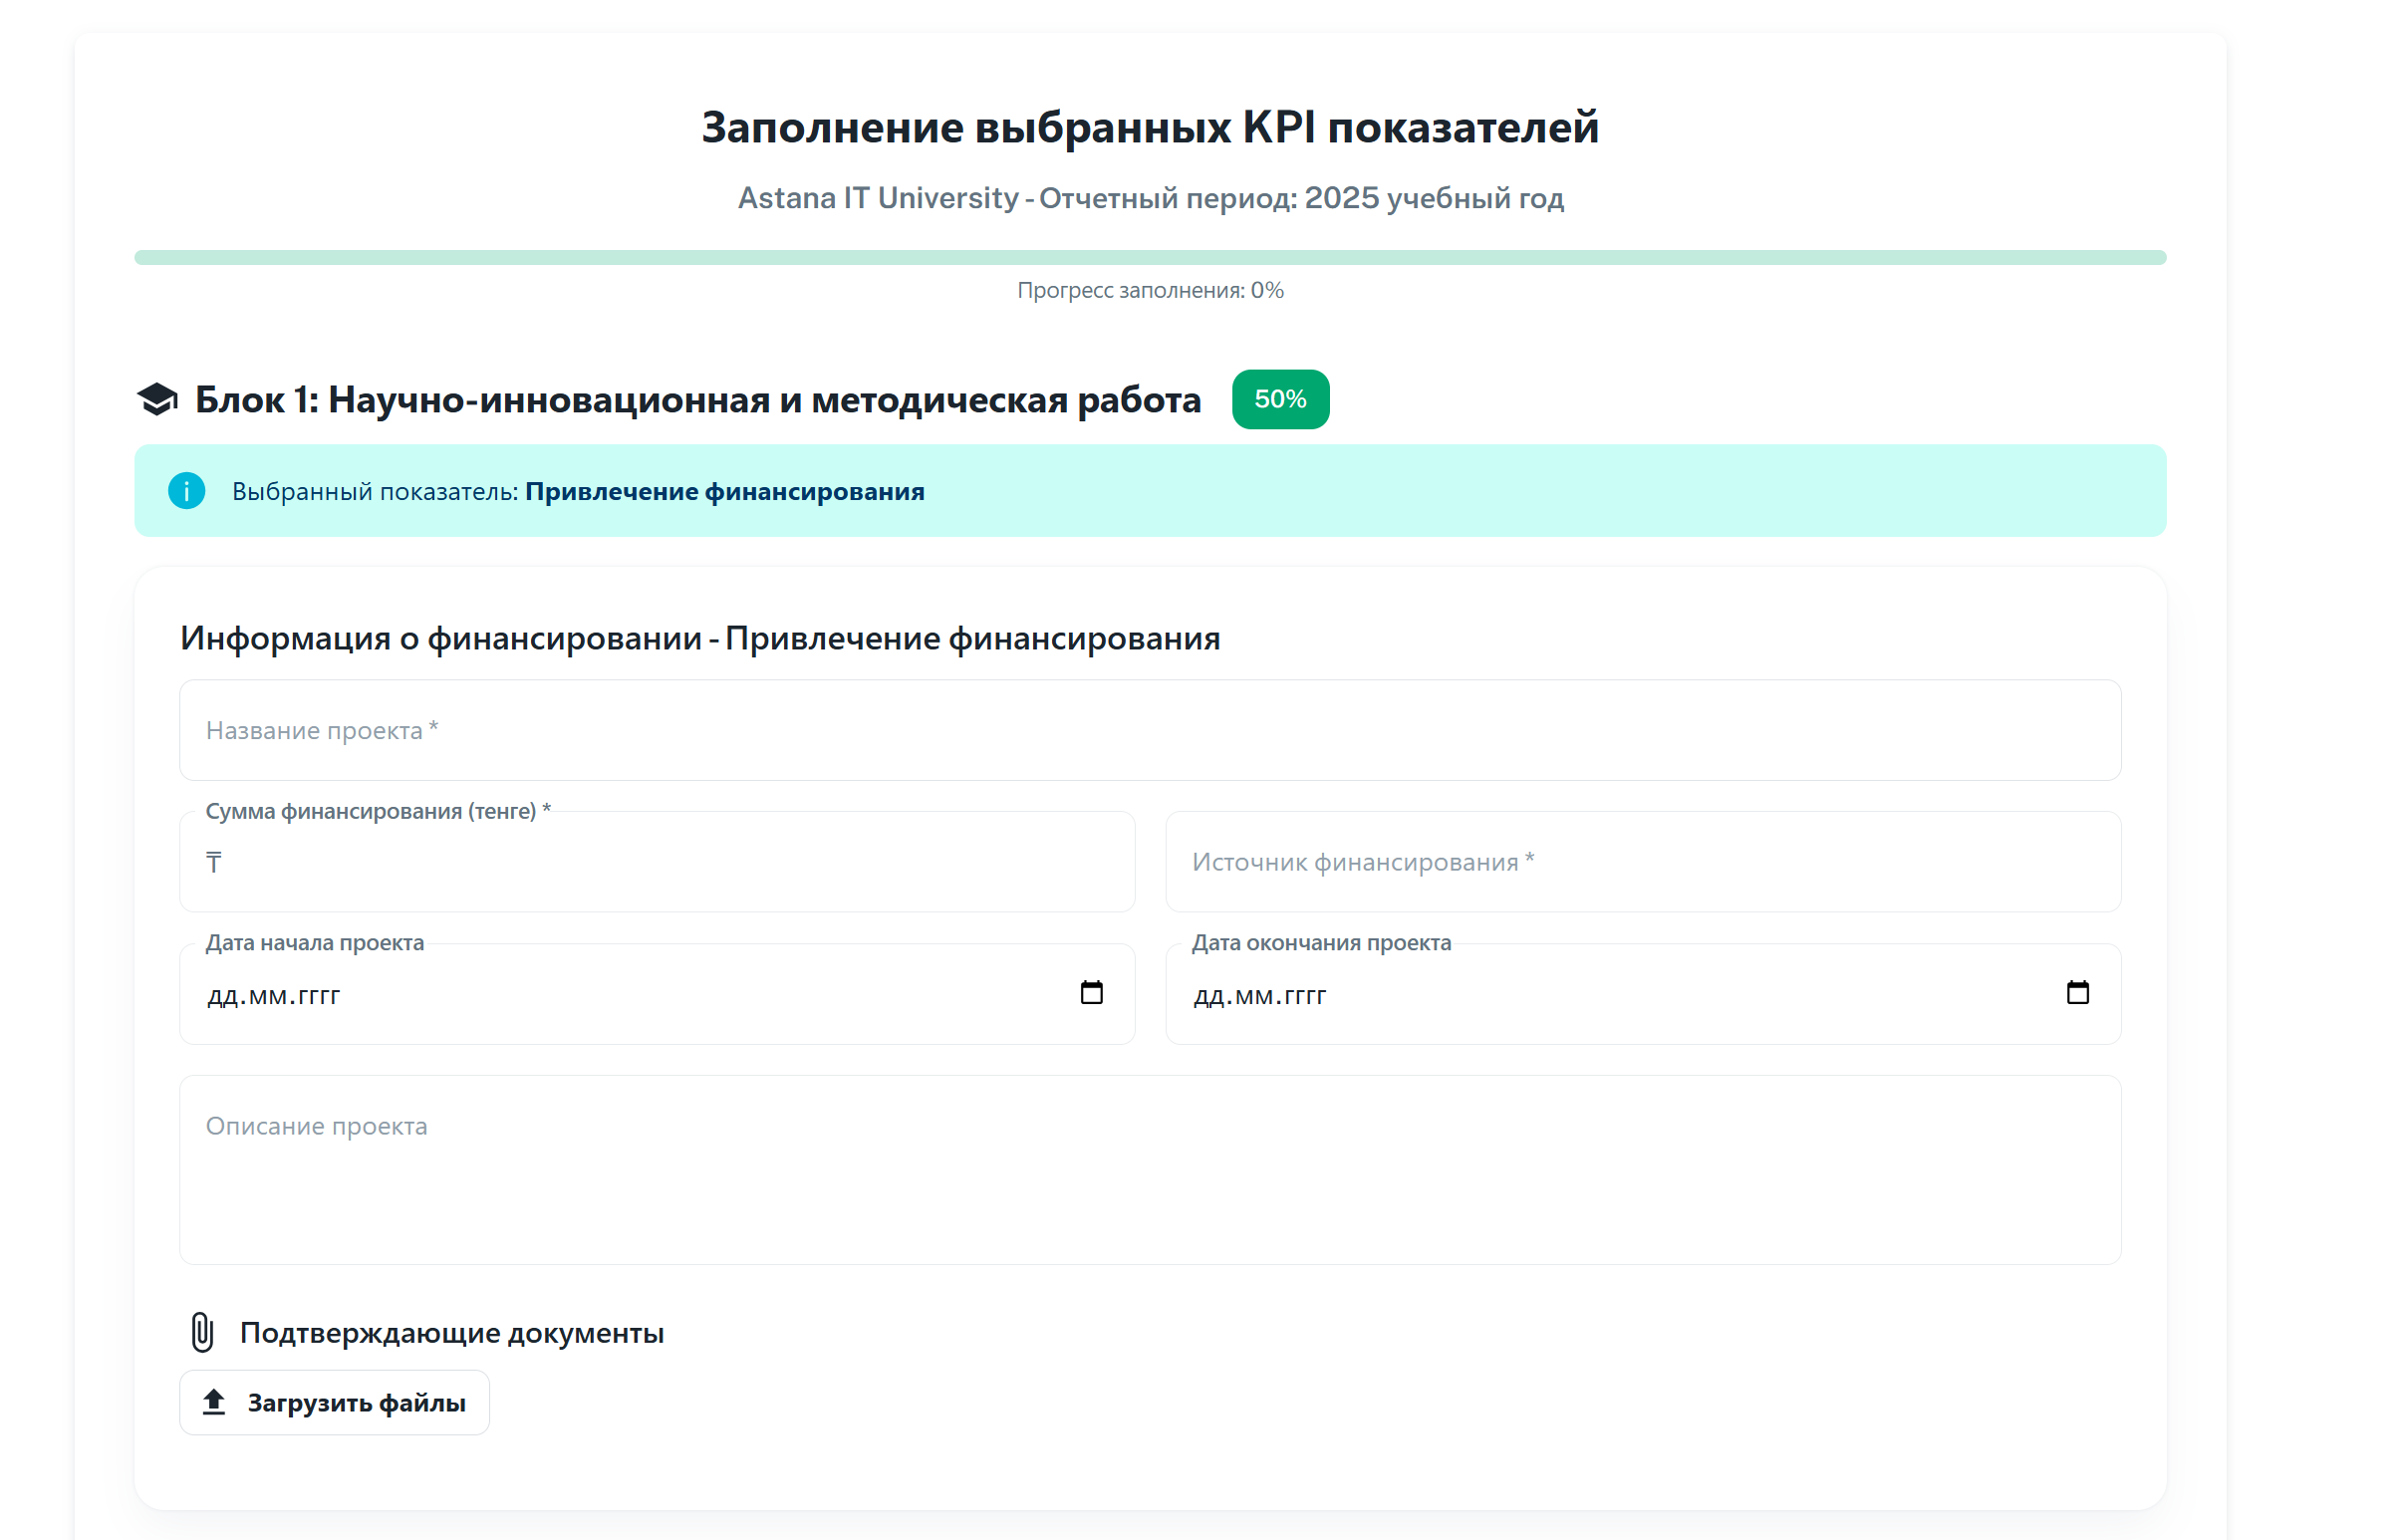
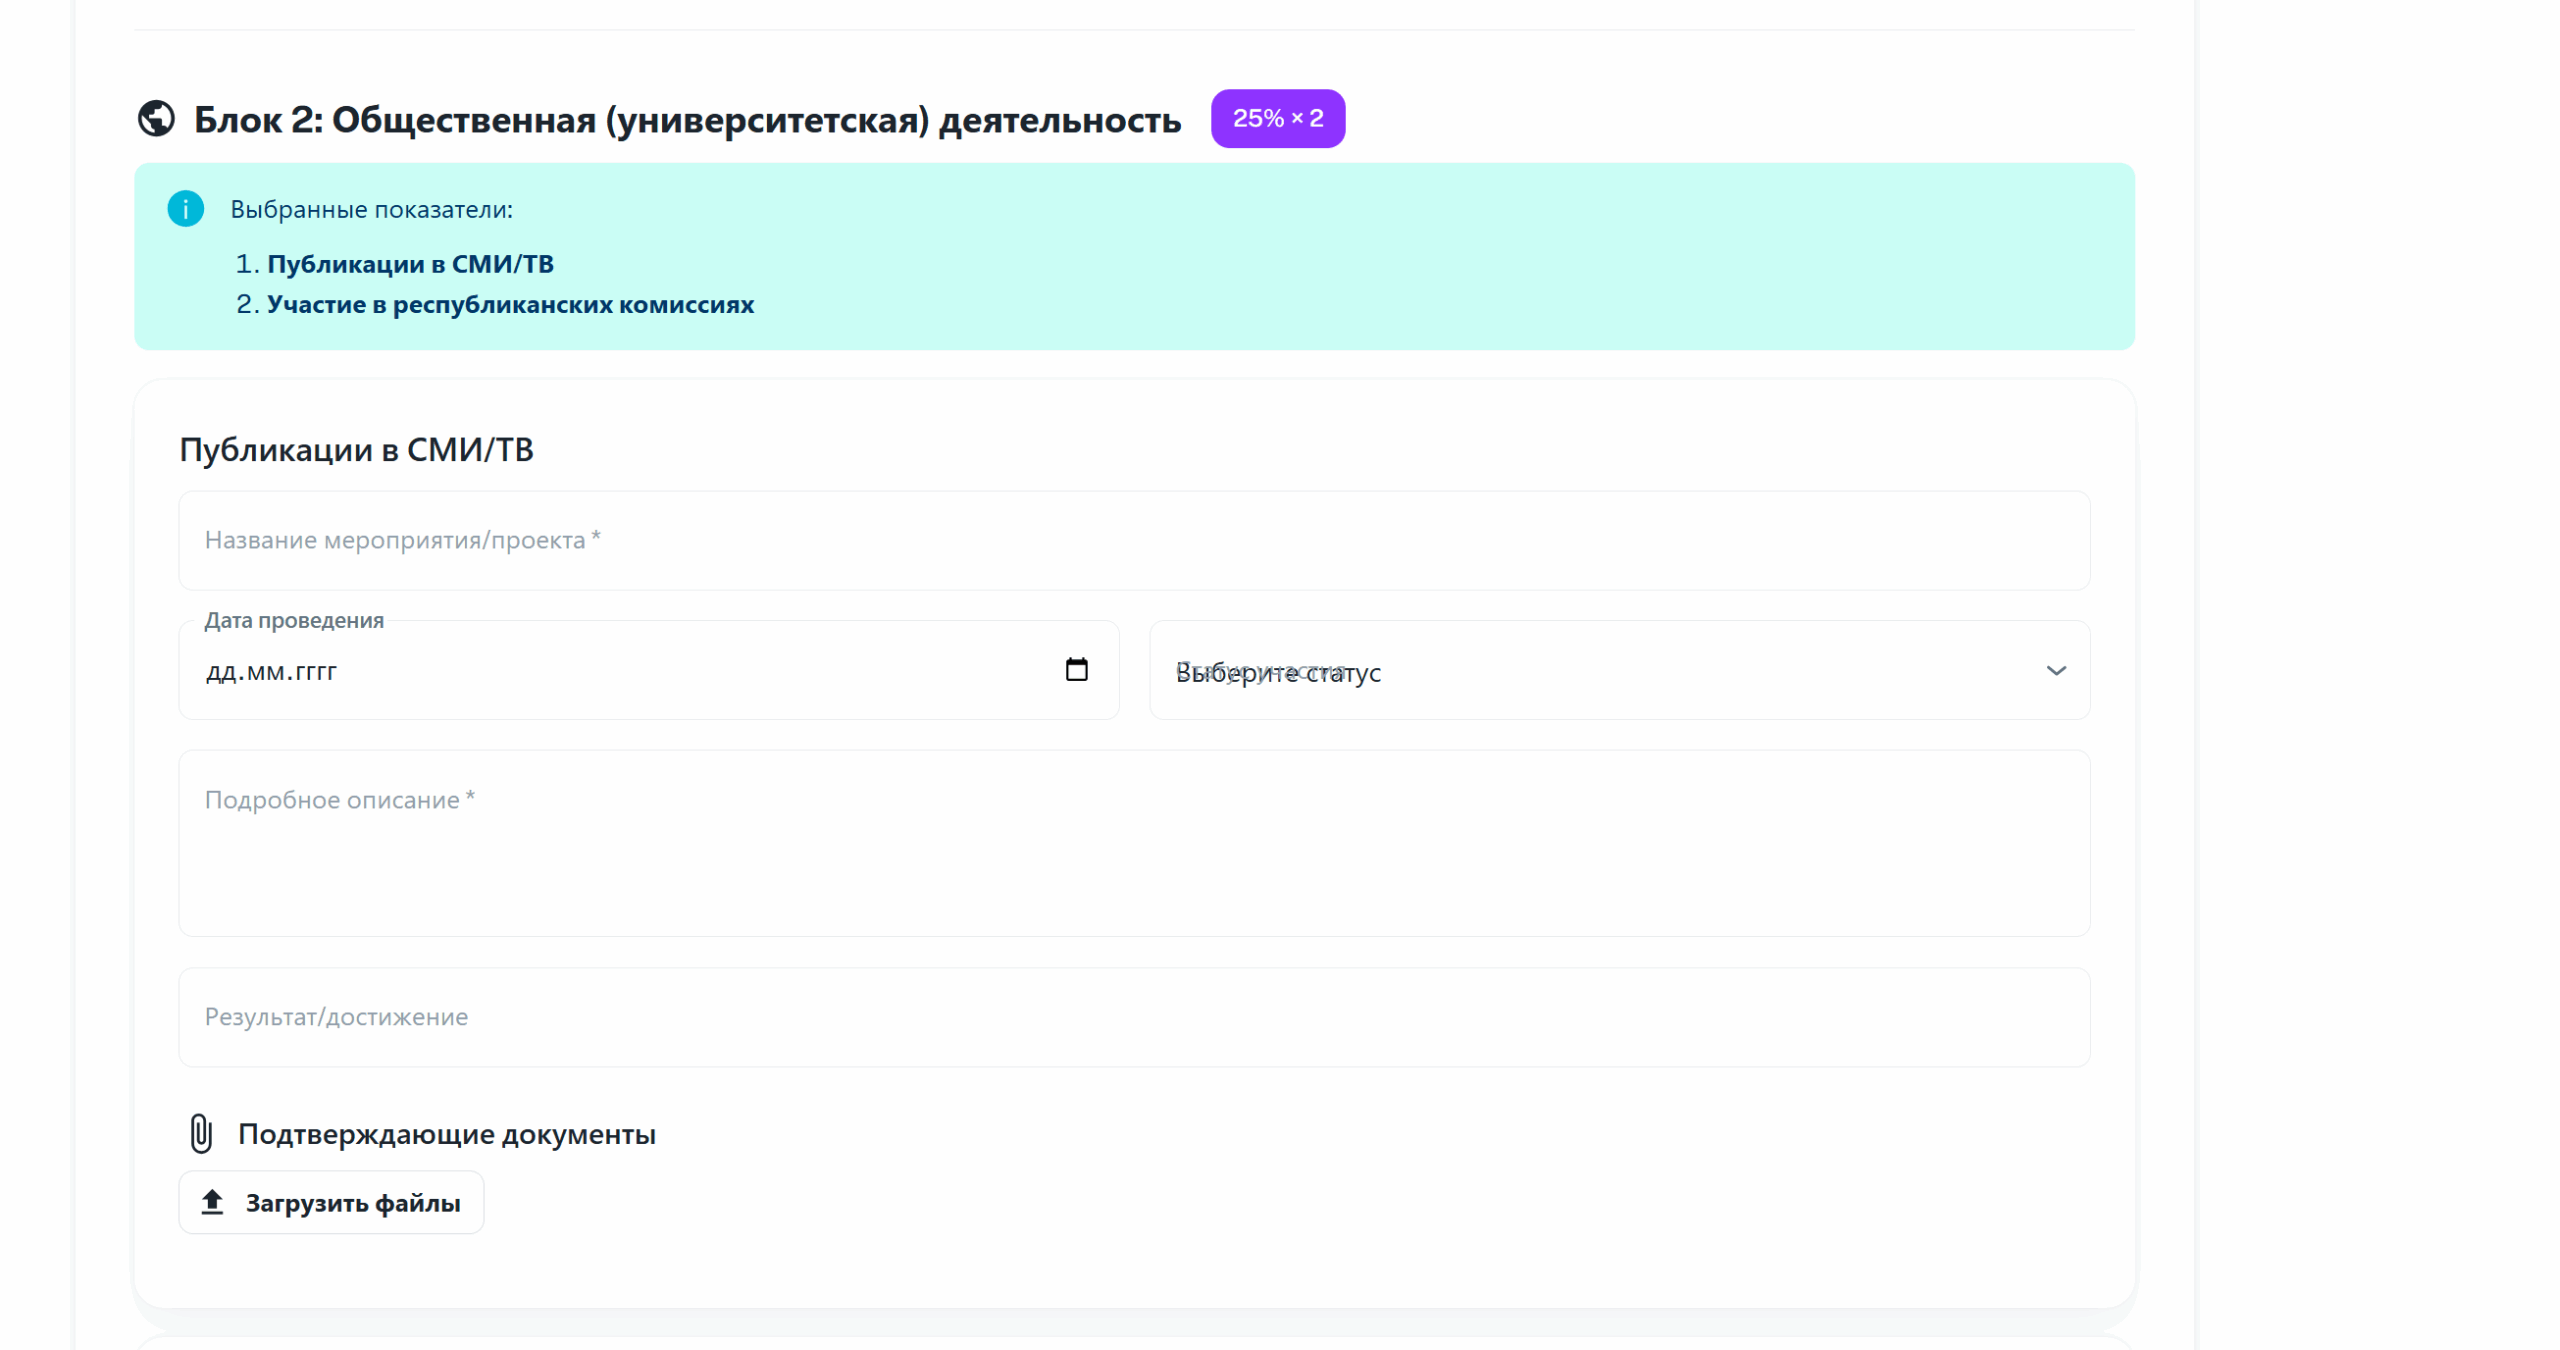
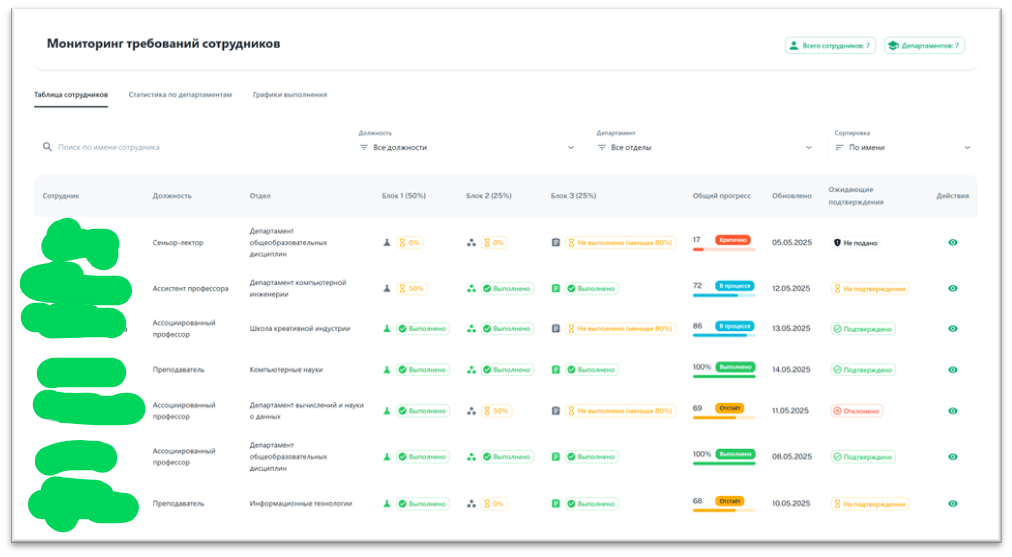
- Role-Specific Functionality: The interface is dynamically tailored to each of the four user roles (Teaching Staff, KPI Commission, Department Head, Rector), ensuring users only see information and actions relevant to their tasks.
- Simplicity and Clarity: The platform was designed to be simple and clear, with built-in validation features to minimize submission errors. This directly addresses the complexity and high risk of human error found in the previous manual process.
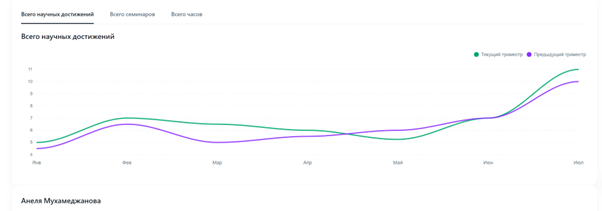
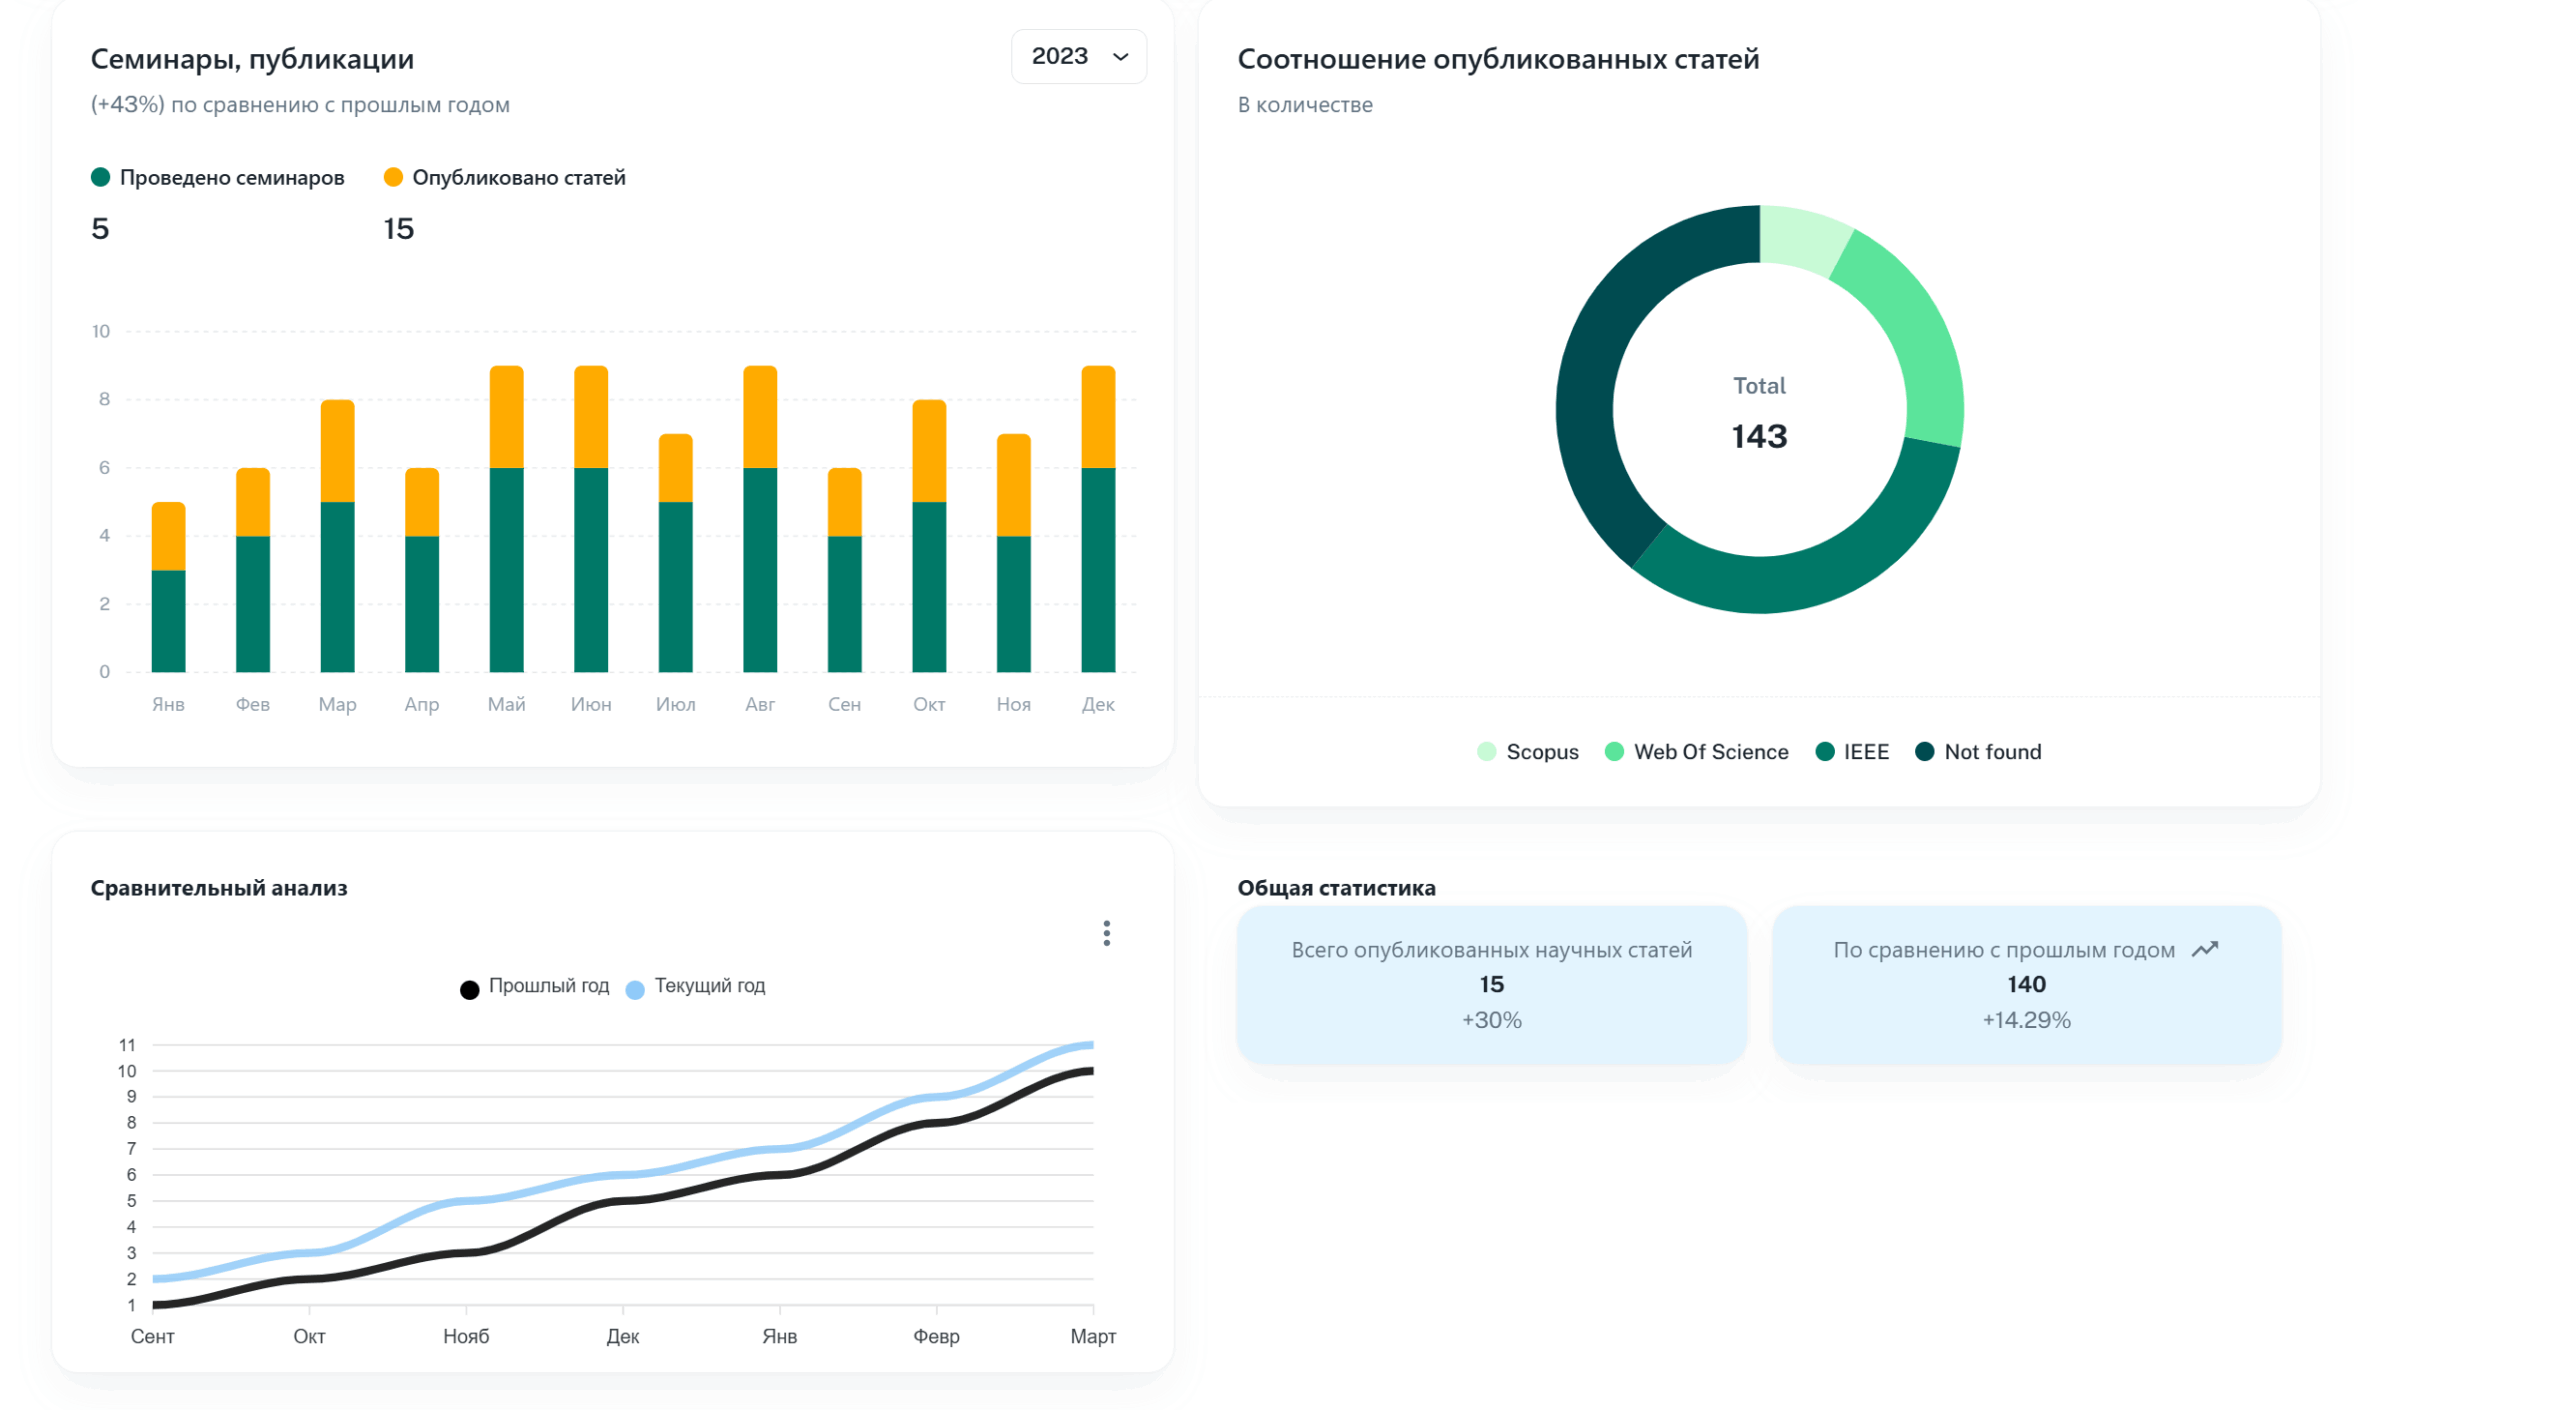
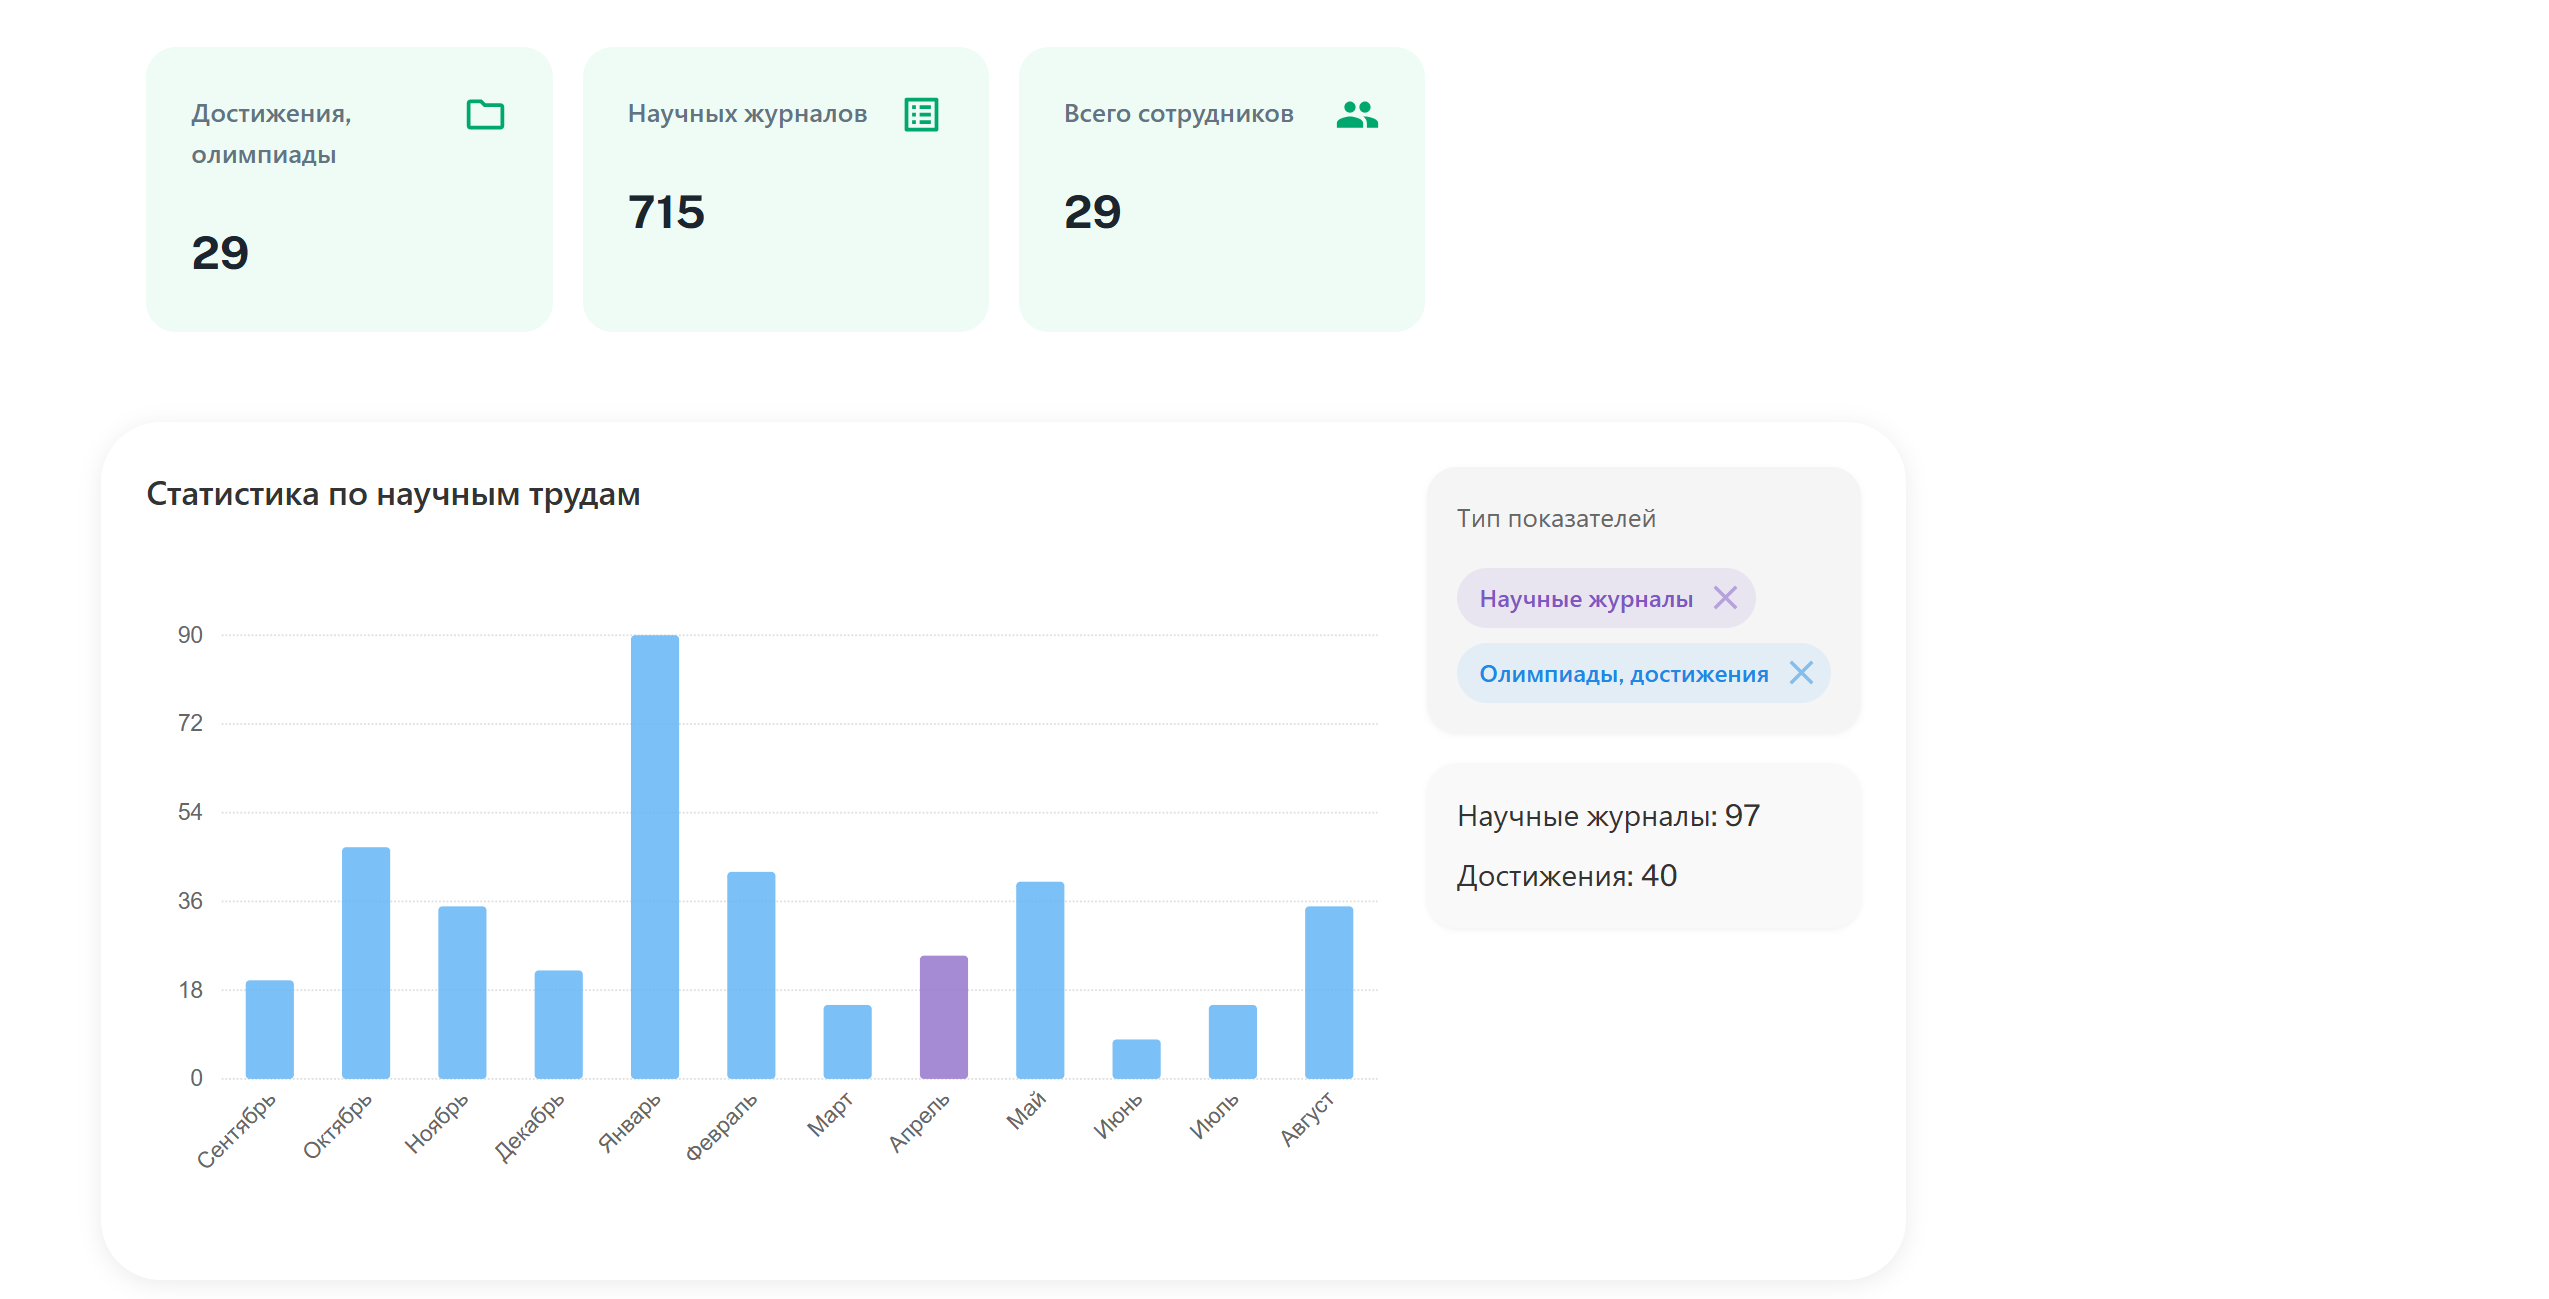
- Data-Driven Dashboards: The system features interactive dashboards with clear data visualizations, allowing for easy interpretation of performance trends and enhancing data-driven decision-making.
This design approach minimizes cognitive load for users and is intended to create a satisfying and pleasant user experience, a conclusion supported by high user satisfaction ratings recorded during testing.